
Learn Relations and Functions with Simple Graph Examples
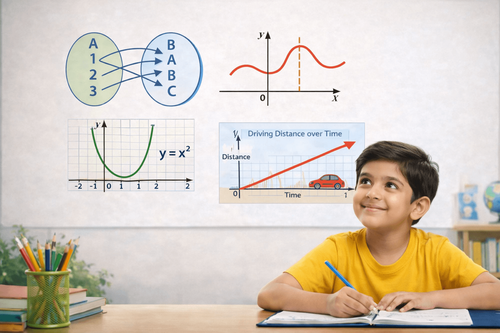

Table of Contents
- Learn Relations and Functions with Simple Graph Examples
- Types of Relations
- Types of Functions
- Difference Between Relation and Function
- How to Convert a Relation into a Function?
- The Representation of Relations and Functions on Graphs
- Simple Tips to Help Kids Master Relations and Functions Usin
- How PlanetSpark Teaches Relations and Functions to Young Lea
- Conclusion
Relations and functions form the backbone of mathematical understanding and logical thinking. They explain how values are connected and how one quantity depends on another. Relations and functions math focuses on pairing inputs with outputs, while graphs visually represent these connections in a clear and meaningful way. When children understand relations, they can easily progress to functions and interpret graphs with confidence.
Strong clarity in relations and functions helps children move beyond memorization and truly understand concepts. Students who grasp these ideas early develop better problem-solving skills, improved analytical thinking, and confidence in tackling advanced math topics. Simple graph examples make learning engaging and remove fear from mathematics.
At PlanetSpark, we simplify algebra problems using visual explanations, step-by-step guidance, and interactive learning. Our structured approach helps children understand graphs, apply concepts accurately, and build lasting confidence in math. Help your child master algebra and complete mathematics with PlanetSpark today.
Learn Relations and Functions with Simple Graph Examples
Relations and functions play an important role in helping children understand how numbers and values connect with each other in a clear and logical way. Instead of seeing numbers as isolated values, students learn how one quantity depends on or changes with another. This understanding helps children recognize patterns, links, and dependencies that appear frequently in everyday math problems.
When relations and functions are introduced using simple graph examples, learning becomes more visual and engaging. Graphs allow children to see how values change, rise, fall, or repeat, rather than memorizing abstract rules. This visual approach reduces fear and confusion, making maths feel more accessible and meaningful.
For example, if we look at how the temperature changes over a few days, we can organize the data as a relation:
- Day 1: 30°C
- Day 2: 28°C
- Day 3: 35°C
- Day 4: 32°C
- Day 5: 30°C
We can plot this on a graph with days on the x-axis and temperature on the y-axis. The graph would show the relation between days and temperature, helping students see how the temperature changes over time. The graph would look something like this:
Examples of Relations and Functions
Example 1: Linear Function
Consider the linear function  . In this function, for every x-value, there is one corresponding y-value. When you graph this, you get a straight line, which means the relationship between x and y is consistent. Here’s what the graph looks like:
Graph of y = 2x + 1
This function represents a linear relationship, where each increase in x leads to a proportional increase in y.
Example 2: Non-Function Relation
Let’s look at a relation that is not a function. If you have the following pairs:
 ,
, 
 ,
, 
This is a relation because the same x-value (1) maps to two different y-values (2 and 3). However, this is not a function because a function must have only one output for each input.
You can plot this on a graph, and it will not pass the vertical line test, which is a way to determine if a graph represents a function.
Boost your child’s relations and functions understanding through interactive, graph-based exercises. Visual learning makes abstract concepts simple and engaging. Start your child’s math confidence journey with PlanetSpark today!
Example 3: Real-Life Example of a Function
A real-life example of a function could be the distance traveled by a car over time. If the car moves at a constant speed, the distance traveled increases with time. If we graph this relationship, we would see a straight line because the distance increases at a constant rate.
In this example, time is the input (x-axis), and distance is the output (y-axis). This is a linear function where the distance depends on time.
Types of Relations
Understanding the relations and functions math begins with noting the types of relations and then functions. Types of relations help students see how elements of sets connect logically. Each relation follows a specific rule that defines how pairs are formed. Below, every type is explained with equal word length to maintain clarity and learning consistency.
Empty Relation
An empty relation contains no ordered pairs because no element satisfies the given condition. For example, if set A = {1, 2, 3} and the rule is “numbers greater than 10,” no elements qualify, so the relation is empty.
Universal Relation
A universal relation includes every possible ordered pair between two sets. For example, if A = {1, 2} and B = {3, 4}, the universal relation contains (1,3), (1,4), (2,3), and (2,4), showing full connectivity.
Inverse Relation
An inverse relation is formed by reversing each ordered pair of a given relation. For example, if R = {(1,2), (3,4)}, then the inverse relation is {(2,1), (4,3)}, helping students understand two-way relationships clearly.
Identity Relation
The difference between relation and function lies in their types. An identity relation connects every element of a set only to itself. For example, if A = {2, 4, 6}, the identity relation is {(2,2), (4,4), (6,6)}, showing that each element matches only with itself.
Reflexive Relation
A reflexive relation ensures that every element is related to itself, though other pairs may also exist. For example, the relation “is less than or equal to” is reflexive because every number is equal to itself.
Symmetric Relation
A symmetric relation means if (a, b) exists, then (b, a) must also exist. For example, if “is a sibling of” relates Rahul to Rina, then Rina must also be related to Rahul.
Equivalence Relation
An equivalence relation satisfies the reflexive, symmetric, and transitive properties. For example, “has the same remainder when divided by 2” groups numbers like 2, 4, and 6 together, forming clear and meaningful equivalence classes.
Transitive Relation
A transitive relation follows logical flow. If (a, b) and (b, c) exist, then (a, c) must also exist. For example, if A is taller than B and B is taller than C, then A is taller than C.
Help your child master algebraic thinking and relations and functions math step by step. With hands-on examples and expert guidance, learning becomes fun and intuitive. Sign up for a free PlanetSpark trial now!
Types of Functions
Understanding different types of functions builds a strong foundation in functions and relations and helps students apply concepts confidently. Here are the main types of functions that you will have to deal with.
Identity Function
In an identity function, every input remains unchanged. For example, f(x) = x. If x = 5, the output is also 5. This function helps children understand basic input-output consistency.
Constant Function
A constant function gives the same output for every input, such as f(x) = 3. No matter what value x takes, the result is always 3, showing fixed relationships clearly.
Polynomial Function
Polynomial functions include terms like x² or 2x + 1. For example, f(x) = x² + 1. These functions are important in relations and functions math because they model real-life patterns like area and motion.
Modulus Function
The modulus function gives the absolute value of a number. For example, f(x) = |x| turns −4 into 4, helping kids understand distance without direction.
Signum Function
The signum function shows whether a number is positive, negative, or zero. For example, f(x) = −1 for negative numbers and 1 for positive ones.
Greatest Integer Function
This function rounds a number down to the nearest integer. For example, f(3.7) = 3, which is useful in practical calculations and graph-based learning.
Difference Between Relation and Function
Understanding the difference between relation and function helps Class 7 students avoid confusion in exams and graphs. While both show connections between numbers, a function follows stricter rules. The table below explains this clearly in a kid-friendly way.
Basis | Relation | Function |
Definition | A relation shows any connection between two sets of values. | A function is a special relation where each input has only one output. |
Denotation | Written as R = {(x, y)} | Written as f(x) = y |
Example | {(1,2), (1,3)} | {(1,2), (2,4)} |
Note | One input can have many outputs. | One input cannot have more than one output. |
Simply put, all functions are relations, but not all relations are functions. This clarity is very important when students study graphs and mappings.
How to Convert a Relation into a Function?
To convert relations and functions into a function, students must ensure that each input has only one output. This rule is the key. Let us understand with simple examples suitable for Indian Class 7 learners.
Suppose a relation is R = {(1,2), (1,3), (2,4)}. Here, input “1” gives two outputs (2 and 3). This is not a function. To convert it into a function, remove one pair with the repeated input. For example, keep {(1,2), (2,4)}.
Another example: R = {(2,5), (3,6), (4,7)}. Each input has exactly one output, so this relation is already a function.
A helpful tip for kids:
Check the inputs first. If any number repeats with different outputs, the relation must be fixed.
This step-by-step checking makes learning relations and functions simple and exam-ready.
Transform abstract math concepts into easy-to-understand skills. Children learn patterns, relationships, and graph interpretation through enjoyable exercises. Kickstart their math mastery journey today!
The Representation of Relations and Functions on Graphs
Understanding functions as well as relations becomes easier when children can see how numbers connect. Visual and symbolic representations help students understand patterns, inputs, and outputs clearly. Learning different representation methods builds strong foundations and makes relations and functions graphs less confusing and more engaging.
Cartesian Plane
In graphical form, relations are shown using ordered pairs plotted on a Cartesian plane. Students choose x-values, calculate corresponding y-values, plot points like (x, y), and join them. This visual method helps children understand patterns, trends, and whether a relation forms a straight line or a curve.
Set Builder Form
Set builder form explains relations and functions using a clear rule connecting two sets. It is written using conditions, such as {(a, b) : a is the square root of b}. This form helps children understand why elements are related and builds logical thinking through mathematical statements.
Roster Form
Roster form lists all ordered pairs that satisfy a relation, such as {(5, 25), (6, 36), (7, 49)}. This method is simple for finite sets and allows kids to easily convert relations into tables or graphs by directly plotting the listed pairs.
Arroe Diagram
An arrow diagram visually shows how elements from one set map to another using arrows. It clearly displays relationships between inputs and outputs. This method helps children quickly identify whether every input has one output, making it useful when learning about functions and mappings.
Tabular Form
In tabular form, relations and functions are represented using a table with input and output columns. This organized layout helps children compare values easily. Tables make it simple to spot patterns, create ordered pairs, and later convert the data into graphs without confusion.
Simple Tips to Help Kids Master Relations and Functions Using Graphs
Understanding relations, functions, and graphs becomes much easier when kids learn them early with smart tricks. Graphs help children see how numbers connect, build logic step by step, and remove fear from mathematical concepts through clarity and practice.
Start with simple ordered pairs: Begin by plotting simple ordered pairs (x, y) on graph paper. For example, plot (1, 2), (2, 4), (3, 6). Show how each x-value (1, 2, 3) connects to a y-value (2, 4, 6). This helps children understand how two numbers relate to each other.
Use real-life examples: Use examples like distance-time graphs. For instance, if you are walking, the graph could show how the distance changes over time. After 1 minute, you're 1 meter away. After 2 minutes, you're 2 meters away. This makes abstract concepts feel more tangible.
Label axes clearly: Teach kids to label the x-axis (horizontal) and y-axis (vertical) clearly. For instance, in a graph showing how many apples you buy over time, label the x-axis with time (in hours) and the y-axis with the number of apples bought. This helps avoid confusion.
Distinguish Between Relations and Functions: Practice identifying if a graph represents a relation or a function. Explain that a function has one output for each input. For example, the graph of y = x² is a function because every x-value has only one y-value. But a graph showing multiple y-values for one x (like a circle) is just a relation, not a function.
Explain Graphs in Words: Encourage kids to explain what the graph shows in their own words. For example, in a graph showing the growth of a plant, they could say, "As time goes by, the height of the plant increases," helping them understand the concept of growth and relation between time and height.
Regular Practice with Fun Activities: Use colorful charts, tables, and small practice problems to help kids revise regularly. For example, give them a table of numbers like this:
| Time (minutes) | Distance (meters) |
|---|---|
| 1 | 2 |
| 2 | 4 |
| 3 | 6 |
Ask them to plot these on a graph, and watch how quickly they understand the relationship between time and distance. These strategies make learning graphs and functions fun and easy to understand!
How PlanetSpark Teaches Relations and Functions to Young Learners?
Solving the problems of algebra, including relations, functions, and graphs, builds logical thinking, problem-solving skills, and confidence in numbers, but many children find it abstract or intimidating. At PlanetSpark, we make algebra fun, interactive, and relatable through one-on-one guidance, visual aids, and step-by-step explanations.

Kids learn variables, expressions, and equations while enjoying real-life examples like sharing candies, calculating allowances, or planning games. Our personalized approach ensures conceptual clarity, steady confidence, and a positive attitude toward math. With engaging exercises, continuous feedback, and expert trainers, PlanetSpark helps children see algebra as approachable, meaningful, and exciting, transforming it into a skill they can master and enjoy confidently.
Step-by-Step Concept Building
PlanetSpark breaks algebra into small, manageable steps. Students learn about variables, constants, and expressions gradually, ensuring strong foundational understanding.
Interactive Visual Learning
Using relations, functions, and graphs, abstract concepts become tangible. Kids can see algebra in action, improving retention and comprehension.
Personalized 1:1 Coaching
Each child receives tailored guidance, addressing doubts in real-time. Your kid can get lessons according to their learning styles, which further helps boosting confidence.
Hands-On Practice & Fun Exercises
Children solve puzzles, games, and quizzes designed to reinforce algebra concepts. This helps keep learning exciting and motivating.
Continuous Feedback & Encouragement
PlanetSpark offers instant feedback and progress tracking, allowing you to monitor your child's development in math. Celebrate their achievements and keep them motivated with real-time insights and encouragement throughout their learning journey.
Conclusion
Mastering relations and functions is a foundational skill that strengthens logical thinking, problem-solving, and confidence in math. With clear concepts, simple graphs, and guided practice, children can confidently understand relations and functions.
Unlock critical thinking and analytical skills in your child through guided exercises, real-life examples, and interactive practice. Give them the confidence to handle numbers and functions effortlessly. Enroll for a free PlanetSpark session now!
PlanetSpark provides a structured, engaging, and personalized approach to help children understand these concepts. With expert guidance, and interactive graph exercises, your child will gain mastery over it, building confidence to tackle math challenges with clarity and ease.
Frequently Asked Questions
Relations and functions show how elements from one set connect to another. While every function is a relation, not every relation is a function. Learning this distinction helps kids understand mapping, graph behavior, and mathematical logic clearly.
Graphs turn numerical data into visual patterns. They help children see how inputs relate to outputs, making concepts intuitive, strengthening analytical thinking, and building confidence while practicing relations and functions.
Children can use the vertical line test: if a vertical line touches the graph at only one point, it represents a function. This method helps kids distinguish between functions and general relations and functions clearly.
PlanetSpark combines expert teachers, interactive tools, and structured learning paths. By simplifying concepts such as the polynomial remainder theorem, PlanetSpark helps children develop clarity, confidence, and a long-lasting interest in mathematics.
Common errors include plotting points incorrectly, confusing multiple outputs for one input, or misreading graphs. Practicing relations and functions graphs systematically avoid mistakes and reinforces conceptual understanding.
PlanetSpark uses real-life examples, guided graph exercises, and interactive sessions. Children get step-by-step explanations, personalized coaching, and visual learning techniques to master relations and functions effectively while building confidence.