What Is a Pictograph? Learn Data Representation Easily

Last Updated At: 17 Jan 2026
11 min read
Table of Contents
- What Is a Pictograph in Maths?
- Key Features of a Pictograph Chart
- How to Make a Pictograph
- Pictograph Examples for Better Understanding
- How to Make a Pictograph Step-by-Step
- PlanetSpark Success Story: Ashwin Sathish
- How to Read a Pictograph Chart
- Advantages of Using Pictographs for Kids
- Common Mistakes Children Make with Pictographs
- Practice Questions on Pictographs
- Why Choose PlanetSpark?
- Conclusion
Ever noticed how children understand pictures faster than numbers? A pictograph is one of the simplest and most visual ways to represent data, especially for young learners. Instead of using numbers alone, a pictograph uses pictures or symbols to show information clearly and engagingly. This makes it easier for children to understand data, compare quantities, and spot patterns at a glance.
In early maths learning, pictographs play an important role in building data-handling skills. By learning what a pictograph is, how it works, and how to read it correctly, children gain confidence in interpreting information visually.
What Is a Pictograph in Maths?
In maths, a pictograph is a simple and visual way of representing data using pictures or symbols instead of numbers alone. Each picture in a pictograph stands for a specific number of items, which is explained using a key or scale. This makes pictographs especially useful for young learners who are just beginning to understand data handling and basic statistics.
A pictograph helps children see information clearly and quickly. Instead of reading long lists of numbers, they can look at pictures and understand which category has more or fewer items. This visual approach builds confidence and reduces confusion when learning maths concepts.
Key points to understand a pictograph in maths:
Pictures or symbols are used to represent data
Each picture has a fixed value mentioned in the key
Data is organised into categories for easy comparison
Pictographs make counting and analysing data simpler
By learning what a pictograph is in maths, children develop important skills like observation, comparison, and basic reasoning. These skills form a strong foundation for more advanced data representation methods taught in higher classes.

Key Features of a Pictograph Chart
A pictograph chart has certain features that make it easy to read and understand. These features help children interpret data correctly and avoid common mistakes while counting or comparing values.
One of the most important parts of a pictograph chart is the use of clear and meaningful pictures. The symbols should be simple and related to the data being shown, such as apples for fruit data or books for reading habits. This helps children connect the picture with the information easily.
Important features of a pictograph chart include:
A clear title that explains what the data is about
Categories or labels that organise the information
Pictures or symbols that represent the data
A key or scale that shows the value of each picture
Pictograph charts are designed to be visually appealing. They allow children to compare data quickly by counting pictures rather than solving complex sums. This makes learning data representation more enjoyable and effective.
How to Make a Pictograph
Understanding how to make pictograph charts helps children learn data representation in a simple and visual way. By following easy steps, kids can organise information and show it clearly using pictures instead of numbers.
Step 1: Collect the Data
Begin by gathering simple data, such as favourite fruits, pets, or colours of students in a class. Write the data neatly so it is easy to use while creating the pictograph.
Step 2: Choose a Suitable Picture or Symbol
The next step in how to make pictograph is selecting a picture that matches the data. For example, use an apple picture for apples or a book picture for books. Keep the symbols clear and consistent throughout the chart.
Step 3: Decide the Scale or Key
The key explains what one picture represents. For instance, one picture may represent two students or five items. Writing the key clearly is very important when learning how to make pictograph correctly.
Step 4: Draw the Pictograph Chart
Create rows or columns for each category and place the pictures according to the data collected. Make sure the pictures are evenly spaced and easy to count.
Step 5: Add a Title and Labels
The final step in how to make pictograph is adding a clear title and proper labels. This helps readers understand what the data is about at a glance.
Pictograph Examples for Better Understanding
Pictograph examples help children understand how data is shown using pictures. These examples usually involve everyday objects that children are familiar with, making learning relatable and fun.
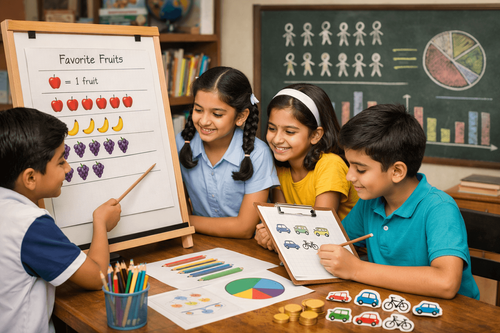
For example, a pictograph may show the number of fruits sold in a day using pictures of apples, bananas, and oranges. If one apple picture represents two apples, then three apple pictures mean six apples. This helps children practise counting while also understanding how the scale works.
Common pictograph examples for children include:
Number of students who like different fruits
Favourite animals in a class
Toys owned by children
Weather data for a week
Using pictograph examples encourages children to read, interpret, and answer questions based on visual data. It improves logical thinking and helps them understand comparisons like more, less, or equal. Regular practice with examples makes pictographs easy and enjoyable to learn.
Help your child build confidence and express ideas clearly with PlanetSpark’s expert-led communication programs
How to Make a Pictograph Step-by-Step
Learning how to make a pictograph is easy when broken down into simple steps. A pictograph is created by organising data and representing it using pictures, making it ideal for children and beginners in maths. Following a step-by-step approach helps avoid confusion and ensures the data is shown accurately.
First, data must be collected. This data can come from a simple survey or observation, such as favourite fruits, pets, or colours in a class. Once the data is ready, the next step is choosing a picture or symbol. The picture should match the data category—for example, using an apple symbol to represent apples. Keeping symbols simple ensures clarity.
Next, deciding the scale is very important. The scale tells how much one picture represents, such as one picture equals two or five items. Choosing a suitable scale makes the pictograph neat and easy to count.
Steps to make a pictograph clearly:
Collect and organise the data
Choose a suitable picture or symbol
Decide the value of each picture (scale)
Draw the chart neatly and label it
Finally, the pictograph chart is drawn with proper labels and a title. A key explaining the scale must be added so readers can interpret the data correctly.
PlanetSpark Success Story: Ashwin Sathish

Ashwin Sathish, a Grade 8 student from New Delhi, is a powerful example of how the right guidance can help a child find their voice and use it confidently. At just 13 years old, Ashwin achieved what many dream of—becoming a TEDx Speaker and sharing ideas that spark meaningful conversations.
Through consistent practice, structured speaking frameworks, and confidence-building activities, Ashwin transformed from a classroom learner into a speaker capable of commanding a global stage. He learned how to organise his thoughts, express ideas clearly, and speak with purpose—skills that go far beyond academics.
Ashwin’s journey highlights the true power of communication. With the right mentorship and opportunities, he discovered his voice, developed vision, and showed the courage to speak up on topics that matter. His success reflects how nurturing communication skills early can help children become confident thinkers, leaders, and changemakers
How to Read a Pictograph Chart
Reading a pictograph chart becomes simple once children understand what each part means. A pictograph presents information visually, so the first step is to carefully look at the chart before counting anything.
The most important part to identify is the key or scale. The key explains what one picture represents. For example, one symbol may equal two students or five books. Without understanding the key, the data may be misread.
After identifying the key, the next step is counting the symbols in each category. Children should multiply the number of pictures by the value shown in the key to get the correct total. Half symbols, if used, should also be counted properly.
Important points while reading a pictograph chart:
Always check the key before counting
Count symbols carefully, including half symbols
Compare categories visually to find more or less
Read labels and the title for context
Avoiding common mistakes like ignoring the scale or miscounting symbols helps children interpret data accurately and confidently.
Advantages of Using Pictographs for Kids
Pictographs offer many advantages for children, especially in early maths learning. Since pictographs use pictures instead of numbers alone, they make data representation more engaging and less intimidating for young learners.
One major benefit is that pictographs make learning visual and fun. Children are naturally drawn to images, which helps them stay interested while learning. This visual appeal makes it easier to understand and remember information.
Pictographs also improve observation skills. Children learn to notice patterns, compare quantities, and draw simple conclusions by looking at pictures. These skills are essential for developing logical thinking.
Key advantages of pictographs for kids include:
Easy understanding of data through visuals
Better comparison of information
Improved counting and basic maths skills
Encourages analytical and reasoning abilities
Overall, pictographs help build a strong foundation in data handling. They prepare children for more advanced charts and graphs taught in higher classes, making early maths learning effective and enjoyable.
Book a free demo class today and watch your child transform into a confident speaker.
Common Mistakes Children Make with Pictographs
While pictographs are designed to make data easy to understand, children can still make mistakes if they rush or miss key details. Identifying these common errors helps parents and teachers guide children more effectively and improve their data-reading skills.
Ignoring the key or scale and starting to count pictures without checking what each symbol represents
Counting each picture as one unit even when one symbol stands for multiple items
Miscounting symbols by skipping pictures or counting too quickly
Getting confused when half symbols or partial pictures are used
Forgetting to read the title of the pictograph, leading to misunderstanding of the data
Not paying attention to category labels on the chart
Missing or forgetting to add a key while creating a pictograph
Drawing unclear or inconsistent symbols that make the pictograph hard to read
Practice Questions on Pictographs
Practice questions help children understand pictographs better by applying what they have learned. These questions improve counting skills, observation, and the ability to interpret data correctly.
A pictograph shows the number of students who like different fruits. If one apple symbol represents 2 students, how many students like apples when there are 4 apple symbols?
In a pictograph of pets, one dog symbol stands for 5 pets. If there are 3 dog symbols, find the total number of dogs.
Look at a pictograph showing favourite colours in a class. Which colour has the highest number of symbols?
If one book symbol represents 4 books, how many books are shown by half a symbol?
Compare two categories in a pictograph and answer: Which category has more items and by how many?
Regular practice with pictograph questions helps children become confident in reading charts, understanding keys, and analysing data accurately.

Why Choose PlanetSpark?
Understanding pictographs helps children build strong data-handling and logical thinking skills from an early age. At PlanetSpark, we make learning concepts like pictographs simple, visual, and engaging through structured guidance and interactive learning methods that go beyond rote memorisation.
Personalised Learning: PlanetSpark offers customised lessons that help children understand data representation concepts like pictographs at their own learning pace.
Interactive and Visual Sessions: Live online classes use visual aids, charts, and real-life examples to explain pictographs clearly and effectively.
Concept-Based Maths Learning: Children learn what a pictograph is, how to make pictograph charts, and how to read them correctly by understanding the logic behind data, not just memorising steps.
Activity-Based Practice: Worksheets, exercises, and hands-on activities help children practise creating and interpreting pictographs with confidence.
Expert Educators: Experienced mentors guide children step by step, ensuring clarity in foundational maths concepts and encouraging logical reasoning.
Flexible Online Learning: PlanetSpark’s online classes allow children to learn from the comfort of home with flexible schedules that suit busy routines
Conclusion
Pictographs are a simple yet powerful way to introduce children to data representation. By using pictures instead of numbers alone, pictographs make learning maths more visual, engaging, and easier to understand. Children can quickly compare information, identify patterns, and answer basic questions by observing symbols.
Throughout this guide, we explored what pictographs are, how to read and make them, common mistakes to avoid, and ways to practise effectively. Understanding the key, counting symbols correctly, and reading labels are essential skills that help children interpret pictograph charts accurately.
Frequently Asked Questions
A pictograph in maths is a way of representing data using pictures or symbols, where each picture stands for a certain number of items.
Pictographs use visual symbols instead of numbers alone, making data simple, engaging, and easier for children to compare and remember.
Common pictograph examples include favourite fruits, pets, toys, weather conditions, and classroom surveys.
To make a pictograph, collect data, choose a symbol, decide the scale, draw the chart, and add labels and a key.
PlanetSpark uses interactive lessons, visual examples, and guided practice to help children understand pictographs and build strong foundational maths skills.
PlanetSpark uses visual explanations, real-life examples, and activity-based learning to help children understand pictographs easily. Through guided practice and interactive sessions, children learn how to read, make, and interpret pictograph charts with confidence.
Yes. PlanetSpark focuses on building both maths understanding and communication skills. While learning concepts like pictographs, children are encouraged to explain data, describe patterns, and express their observations clearly, improving overall thinking and speaking abilities.